Column Mapping
The mapping interface helps you connect your source CSV columns to SDTM variables.
Overview
Column mapping is a critical step that defines how your source data transforms into SDTM-compliant output.
flowchart LR
    subgraph Source[Source CSV]
        S1[SUBJ_ID]
        S2[PATIENT_AGE]
        S3[GENDER]
        S4[VISIT_DATE]
    end

    subgraph Mapping[Fuzzy Matching]
        M[Match<br/>Algorithm]
    end

    subgraph Target[SDTM Variables]
        T1[USUBJID]
        T2[AGE]
        T3[SEX]
        T4[RFSTDTC]
    end

    S1 --> M --> T1
    S2 --> M --> T2
    S3 --> M --> T3
    S4 --> M --> T4
    style M fill: #4a90d9, color: #fff
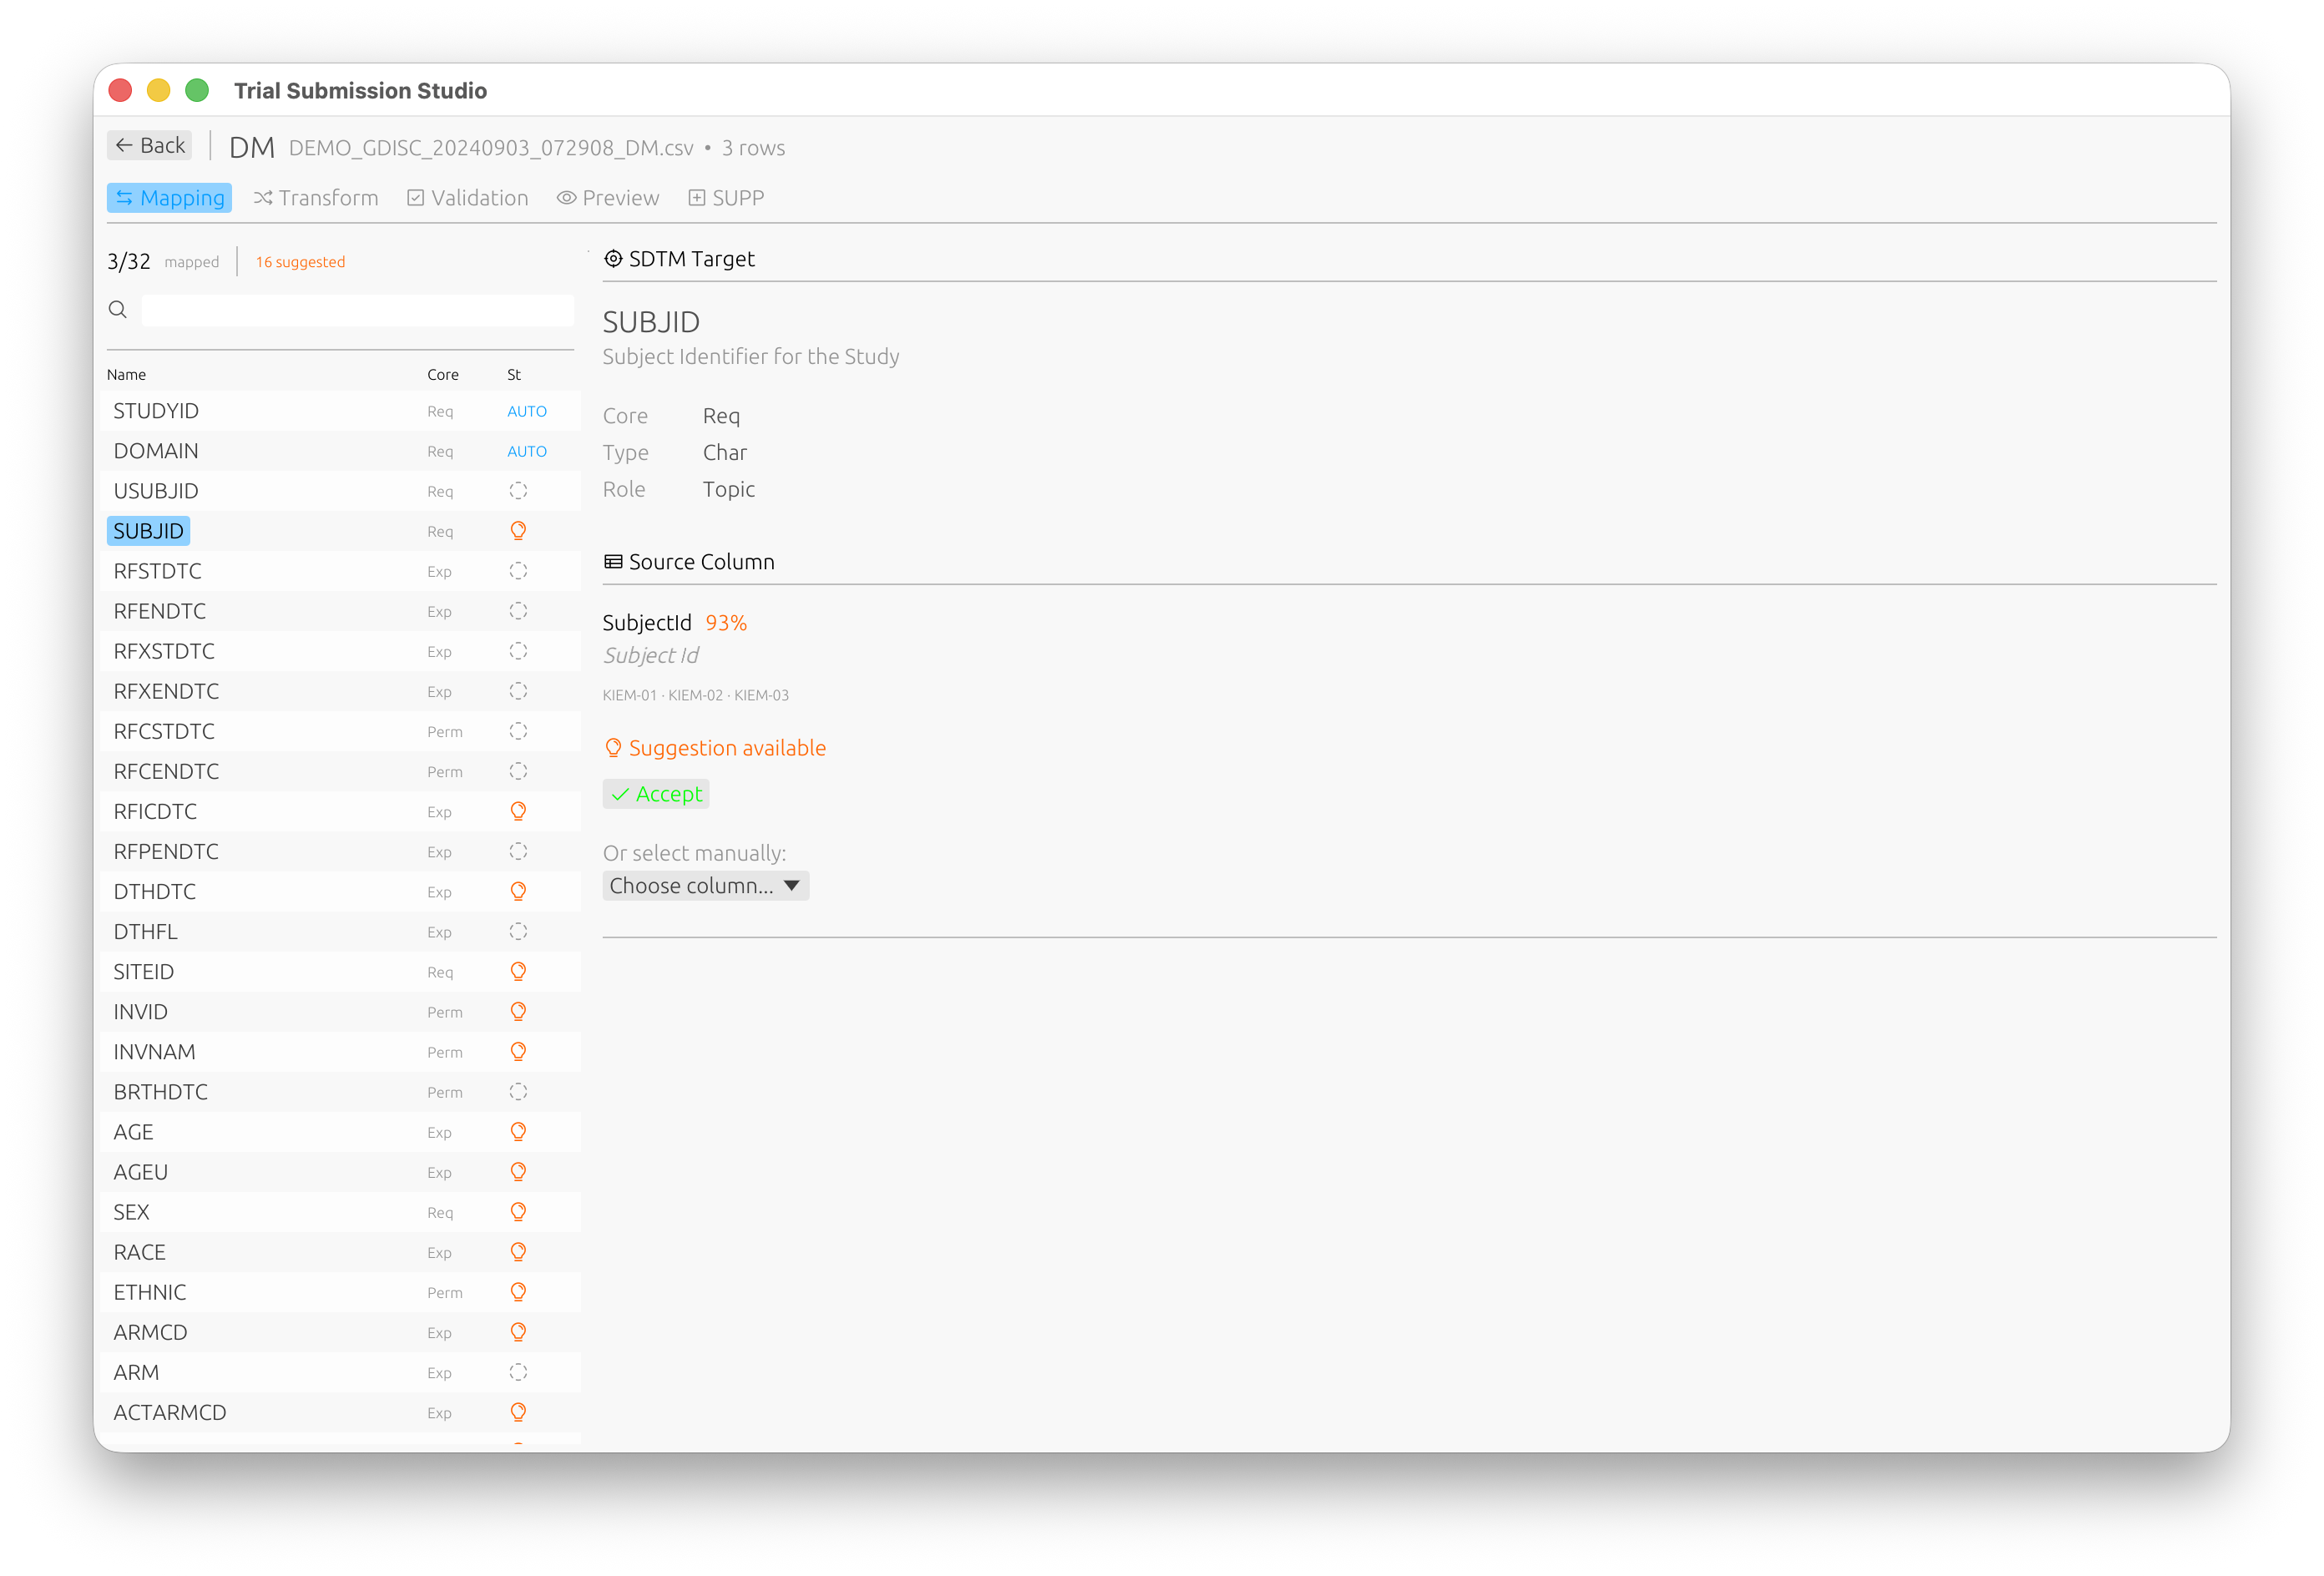
The Mapping Interface
┌─────────────────────────────────────────────────────────────┐
│ Source Columns          │  Target Variables                 │
├─────────────────────────┼───────────────────────────────────┤
│ SUBJ_ID         ────────│──▶  USUBJID                       │
│ PATIENT_AGE     ────────│──▶  AGE                           │
│ GENDER          ────────│──▶  SEX                           │
│ VISIT_DATE      ────────│──▶  RFSTDTC                       │
│ RACE_DESC       ────────│──▶  RACE                          │
│ [Unmapped]              │     ETHNIC (Required)             │
└─────────────────────────┴───────────────────────────────────┘
Automatic Mapping
Trial Submission Studio uses fuzzy matching to suggest mappings:
How It Works
- Analyzes source column names
- Compares against SDTM variable names
- Calculates similarity scores
- Suggests best matches
Match Confidence
- High (>80%) - Strong name similarity, auto-accepted
- Medium (50-80%) - Review recommended
- Low (<50%) - Manual mapping needed
Example Matches
| Source Column | Suggested Variable | Confidence |
|---|---|---|
SUBJECT_ID | USUBJID | 85% |
AGE | AGE | 100% |
GENDER | SEX | 75% |
VSTESTVAL | VSSTRESN | 70% |
Manual Mapping
To Map a Column
- Click on the source column
- Click on the target variable
- A connection line appears
To Unmap a Column
- Click on the connection line
- Or right-click and select “Remove Mapping”
To Change a Mapping
- Remove the existing mapping
- Create a new mapping
Required vs Optional Variables
Required Variables
Shown with a red indicator. Must be mapped for valid output:
STUDYID- Study identifierDOMAIN- Domain abbreviationUSUBJID- Unique subject identifier
Optional Variables
Shown without indicator. Map if data is available.
Expected Variables
Shown with yellow indicator. Expected for the domain but not strictly required.
Data Type Considerations
The mapping interface warns about type mismatches:
| Warning | Description |
|---|---|
| Type Mismatch | Source is text, target is numeric |
| Length Exceeded | Source values exceed SDTM length limits |
| Format Warning | Date format needs conversion |
Controlled Terminology
For variables with controlled terminology:
- The interface shows valid values
- Warns if source values don’t match
- Suggests value mappings
CT Normalization
The Transform tab allows you to normalize values to CDISC Controlled Terminology:
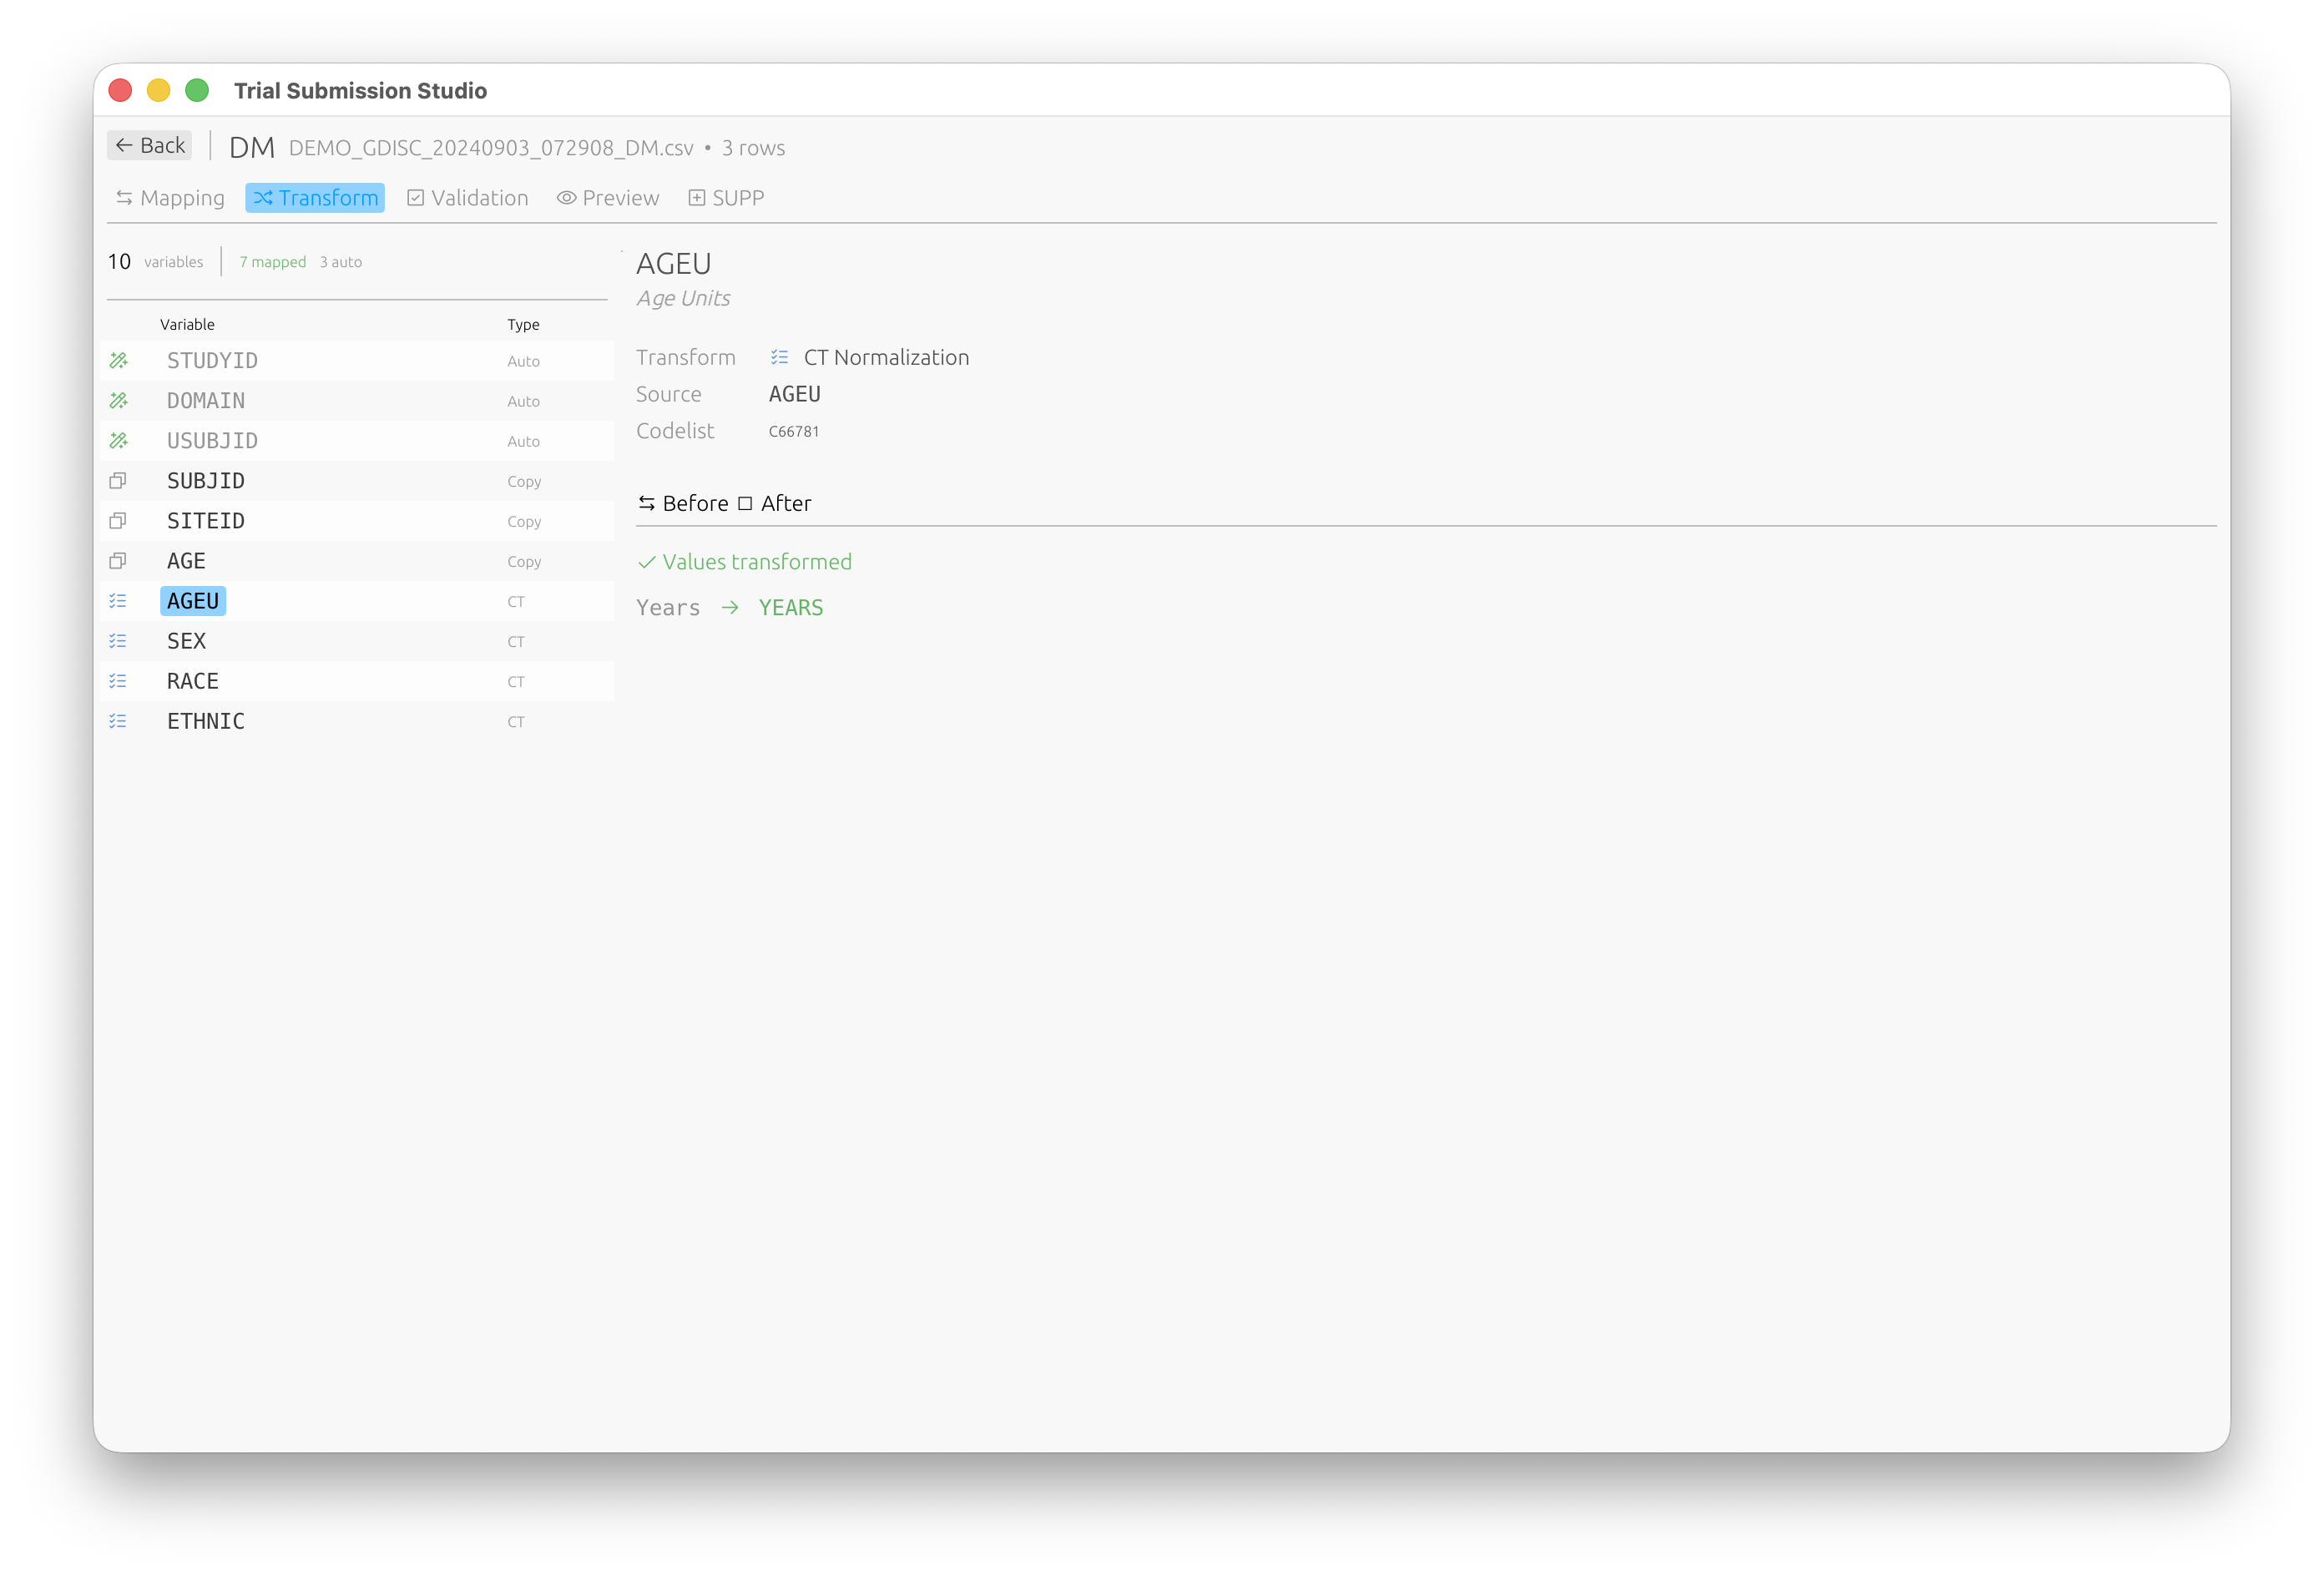
Values are automatically transformed to their standardized form (e.g., “Years” → “YEARS”).
Supplemental Qualifiers (SUPP)
For non-standard variables that need to be captured as supplemental qualifiers, use the SUPP tab:
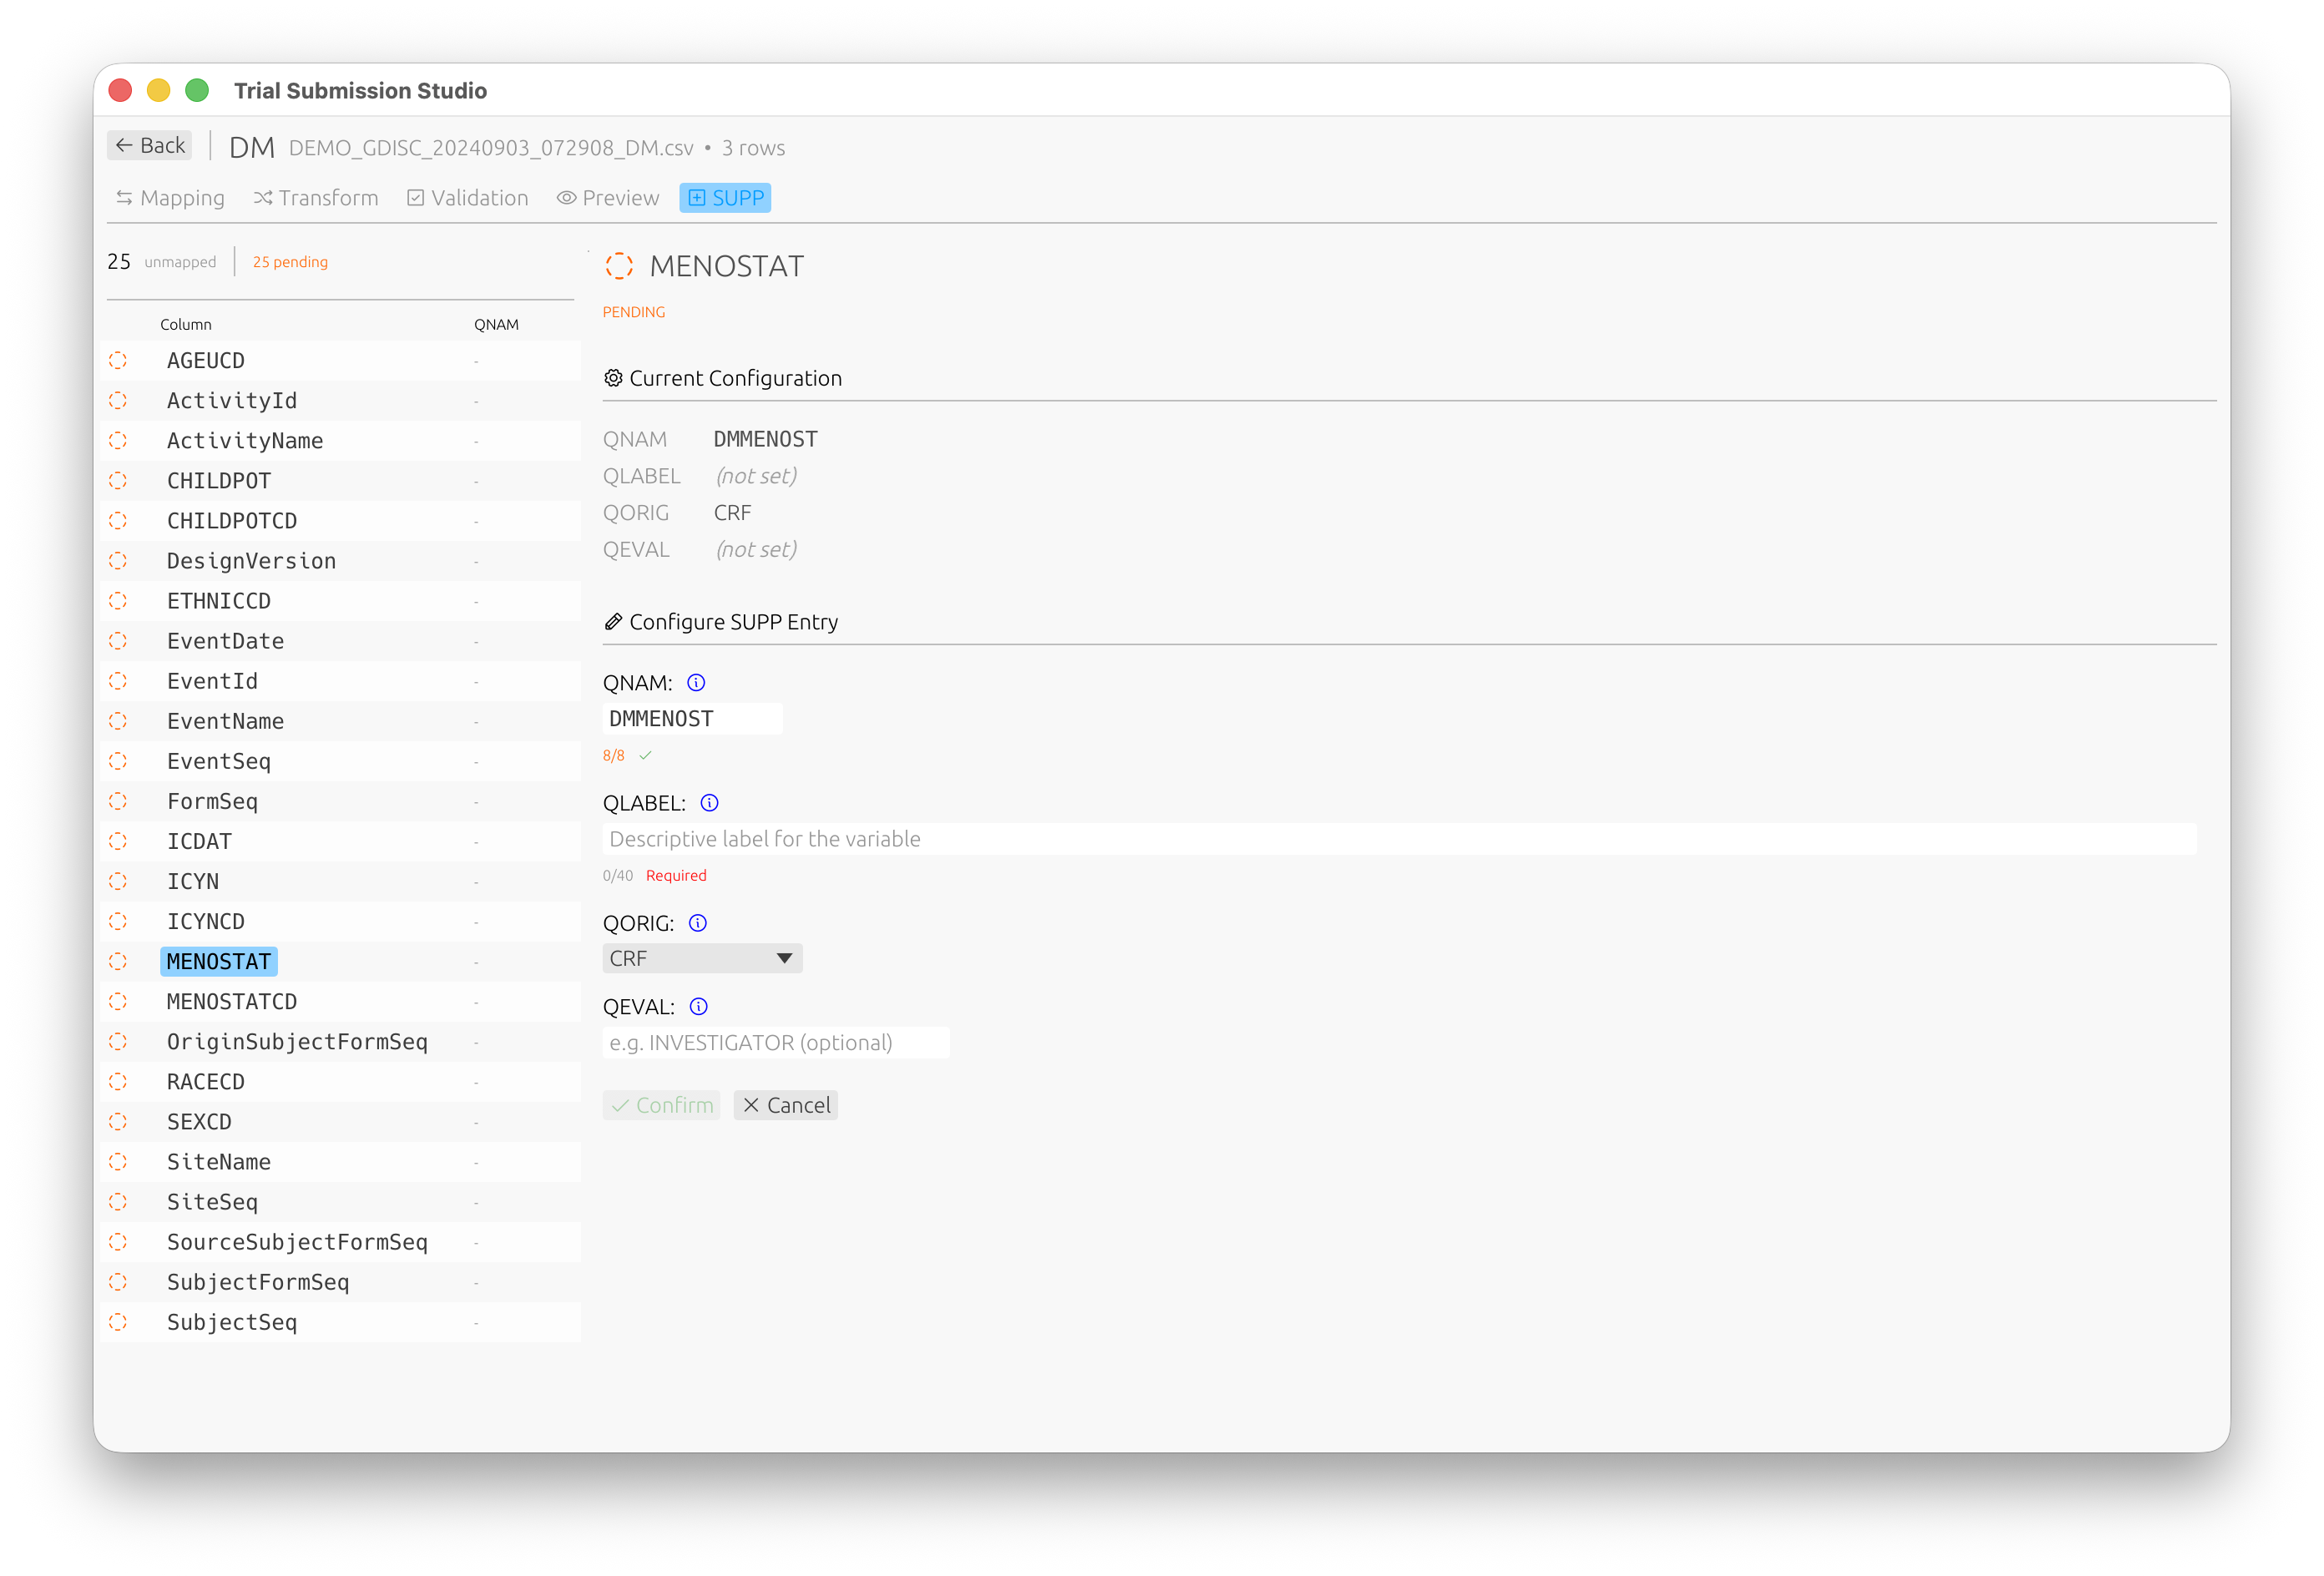
Configure QNAM, QLABEL, QORIG, and QEVAL for each supplemental qualifier variable.
Mapping Templates
Save a Template
- Complete your mappings
- File → Save Mapping Template
- Name your template
Load a Template
- Import your data
- File → Load Mapping Template
- Select the template
- Review and adjust as needed
Best Practices
- Review all automatic mappings - Don’t blindly accept
- Map required variables first - Ensure compliance
- Check controlled terminology - Validate allowed values
- Save templates - Reuse for similar datasets
Next Steps
- Validation - Validate your mappings
- SDTM Variables - Variable reference