Grafana dashboard
The repository ships a sample Grafana dashboard at librechat-exporter-dashboard.json. Import it directly to get a comprehensive overview of your LibreChat metrics.
What's inside
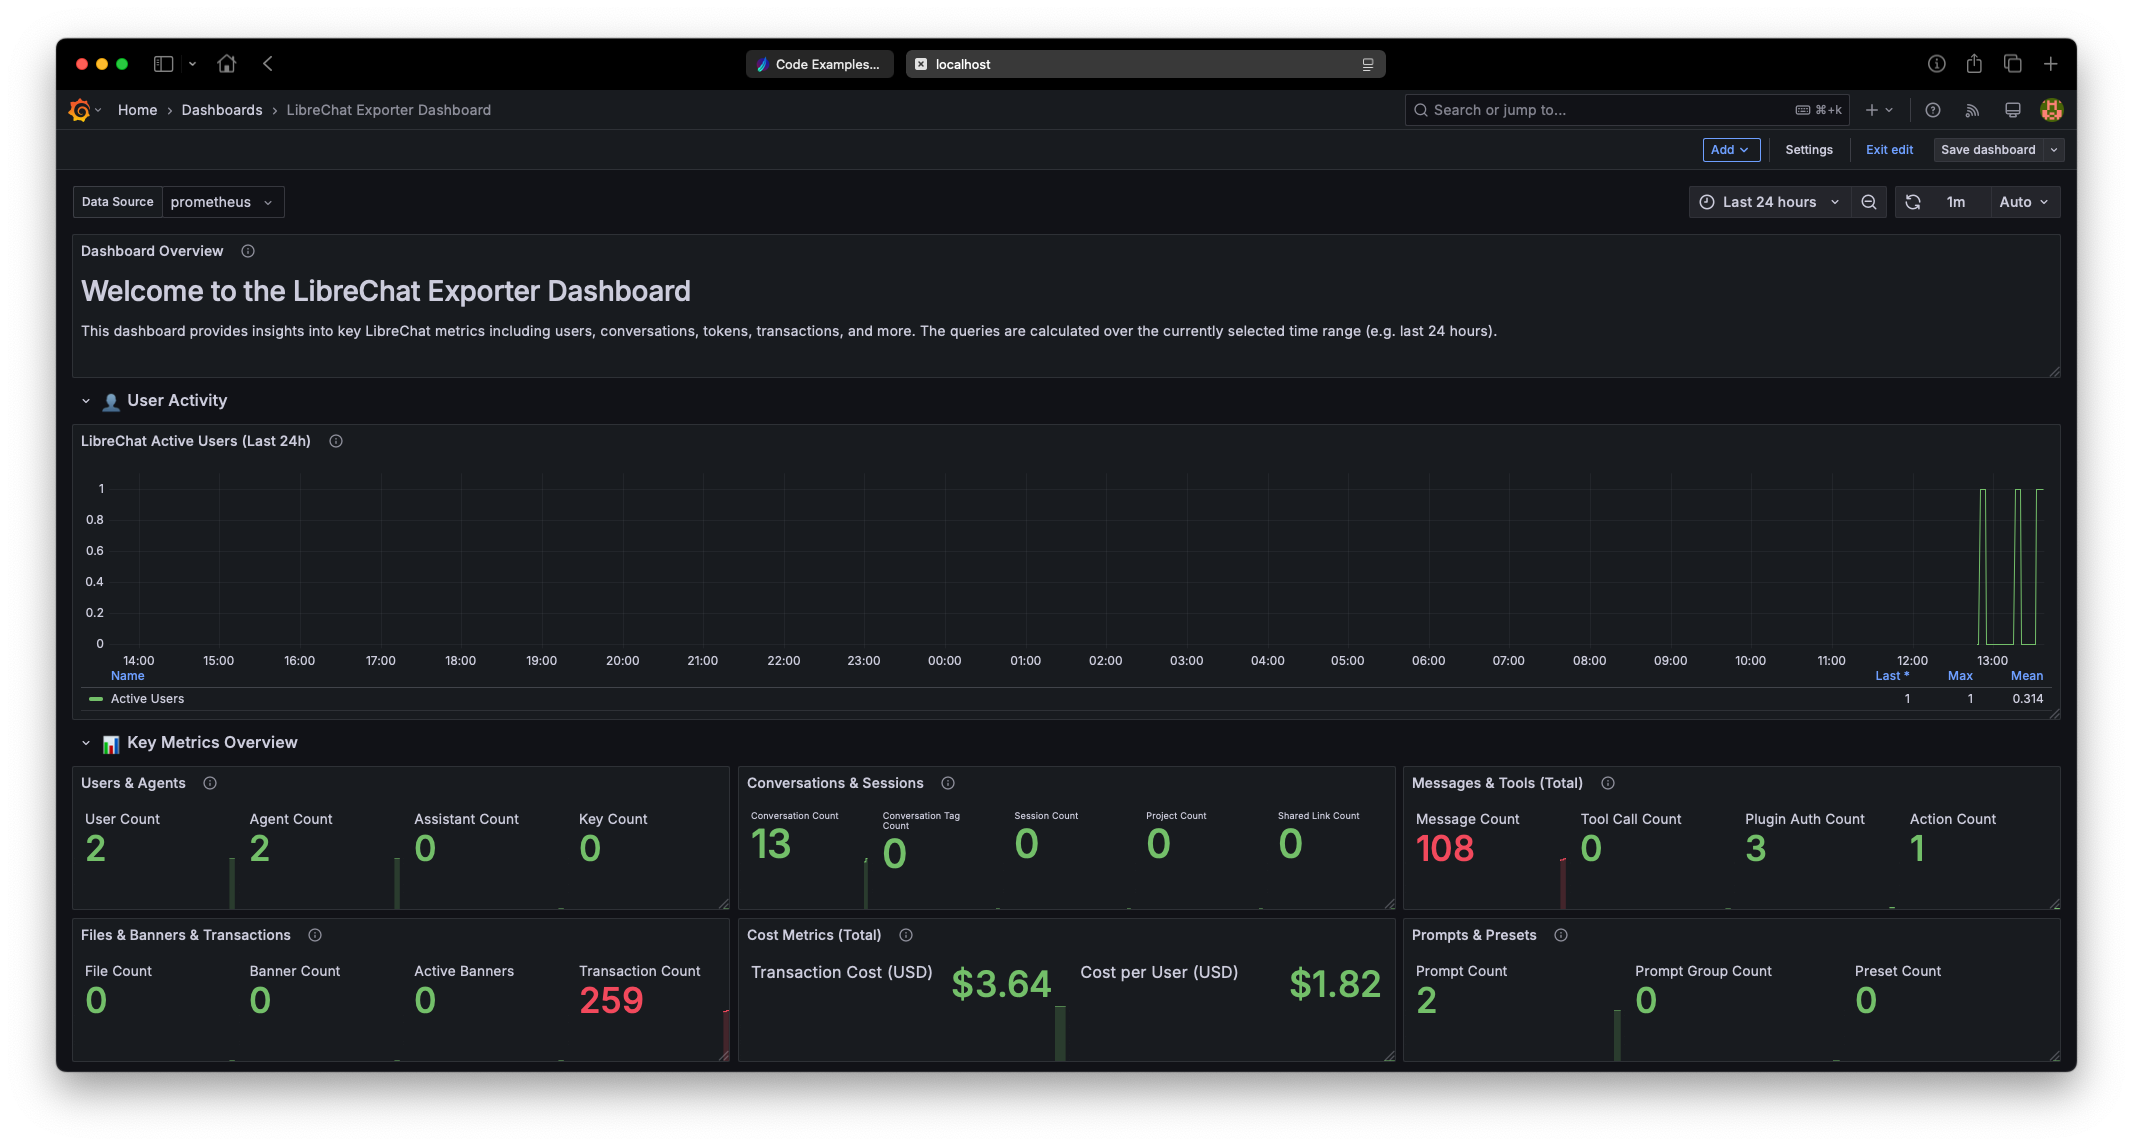
- User Activity — active users, user-provider distribution.
- Key Metrics Overview — counts for users, messages, conversations, transactions.
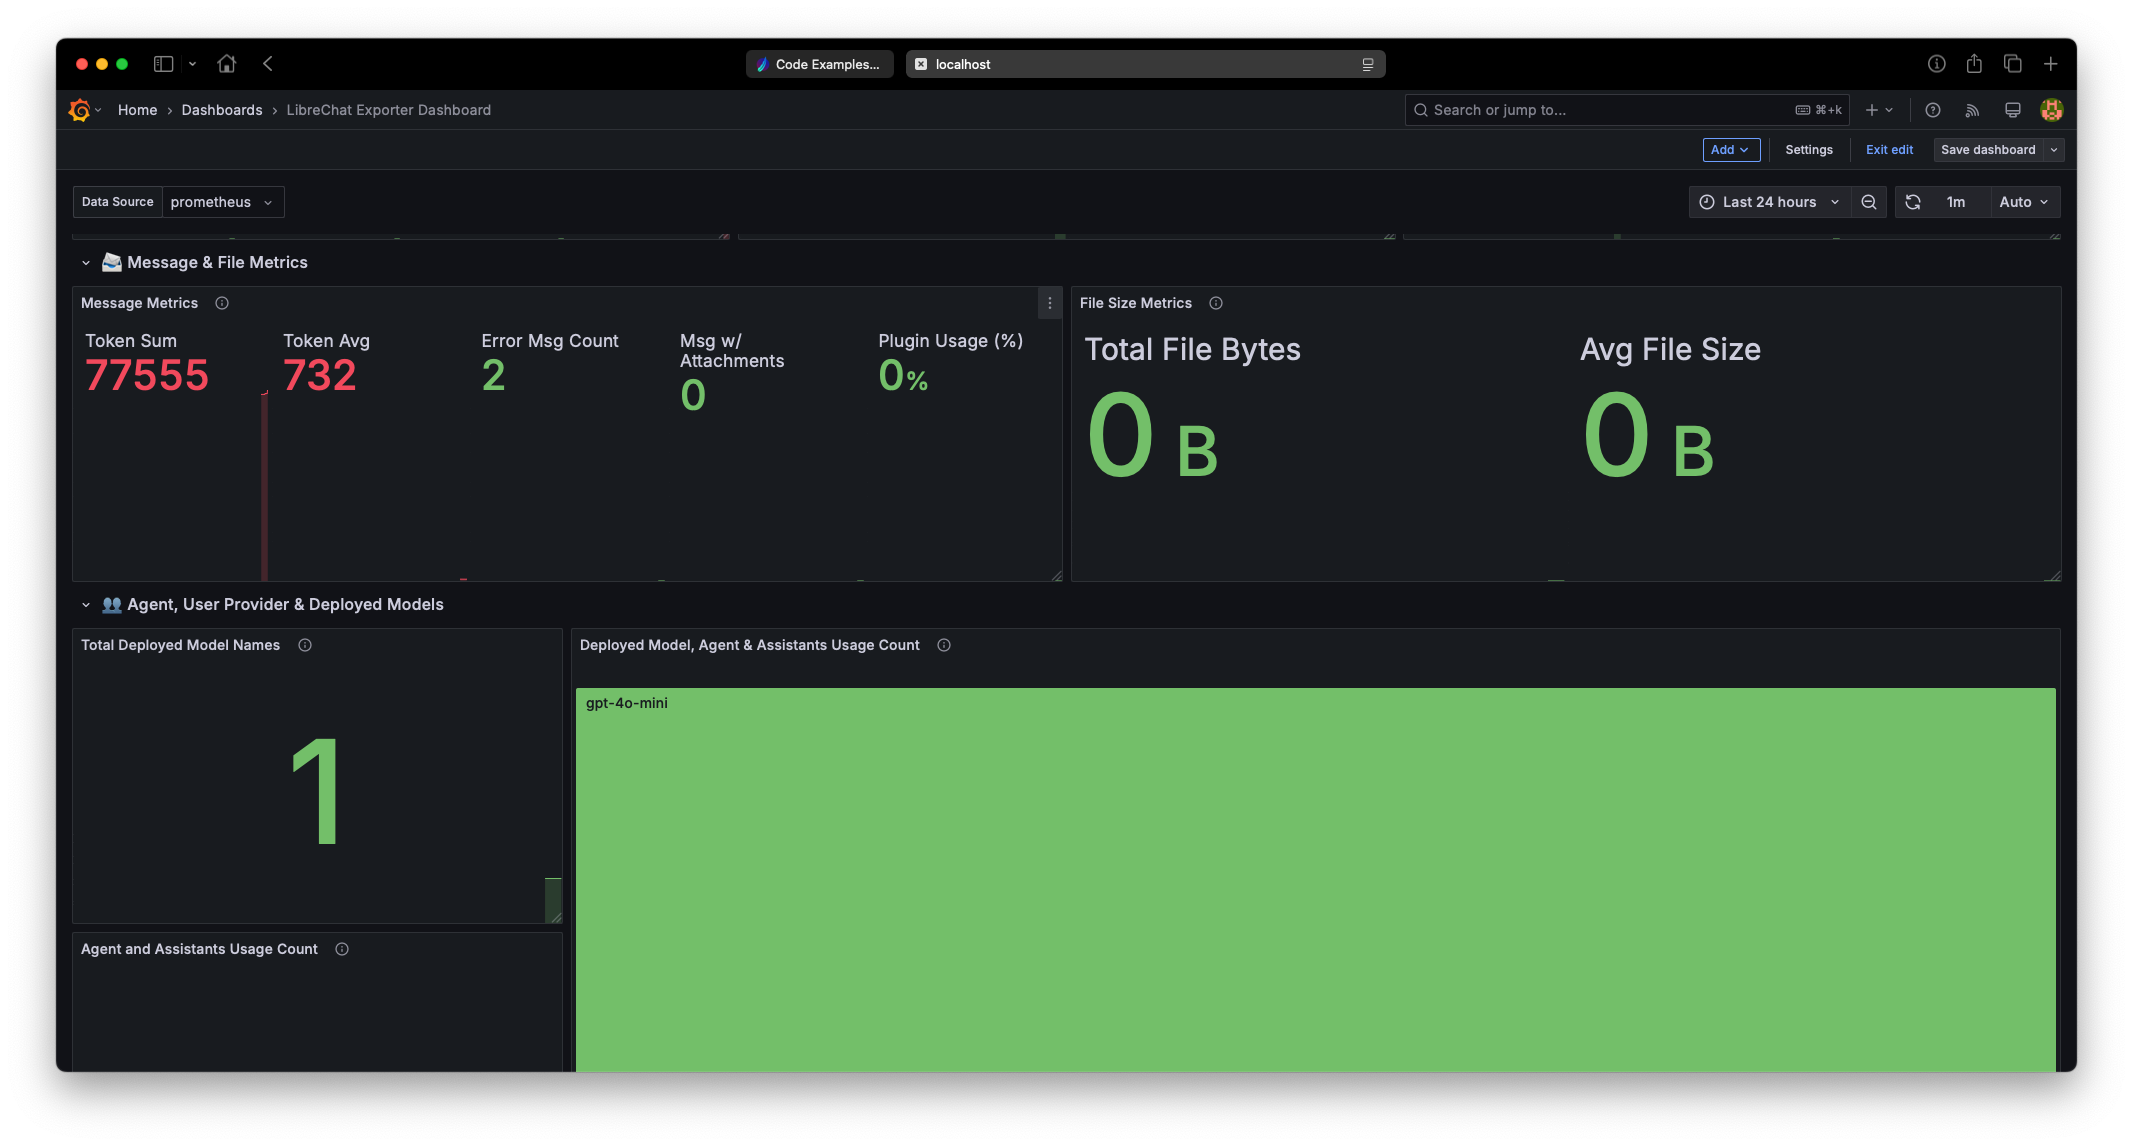
- Message & File Metrics — token usage, plugin usage, file sizes.
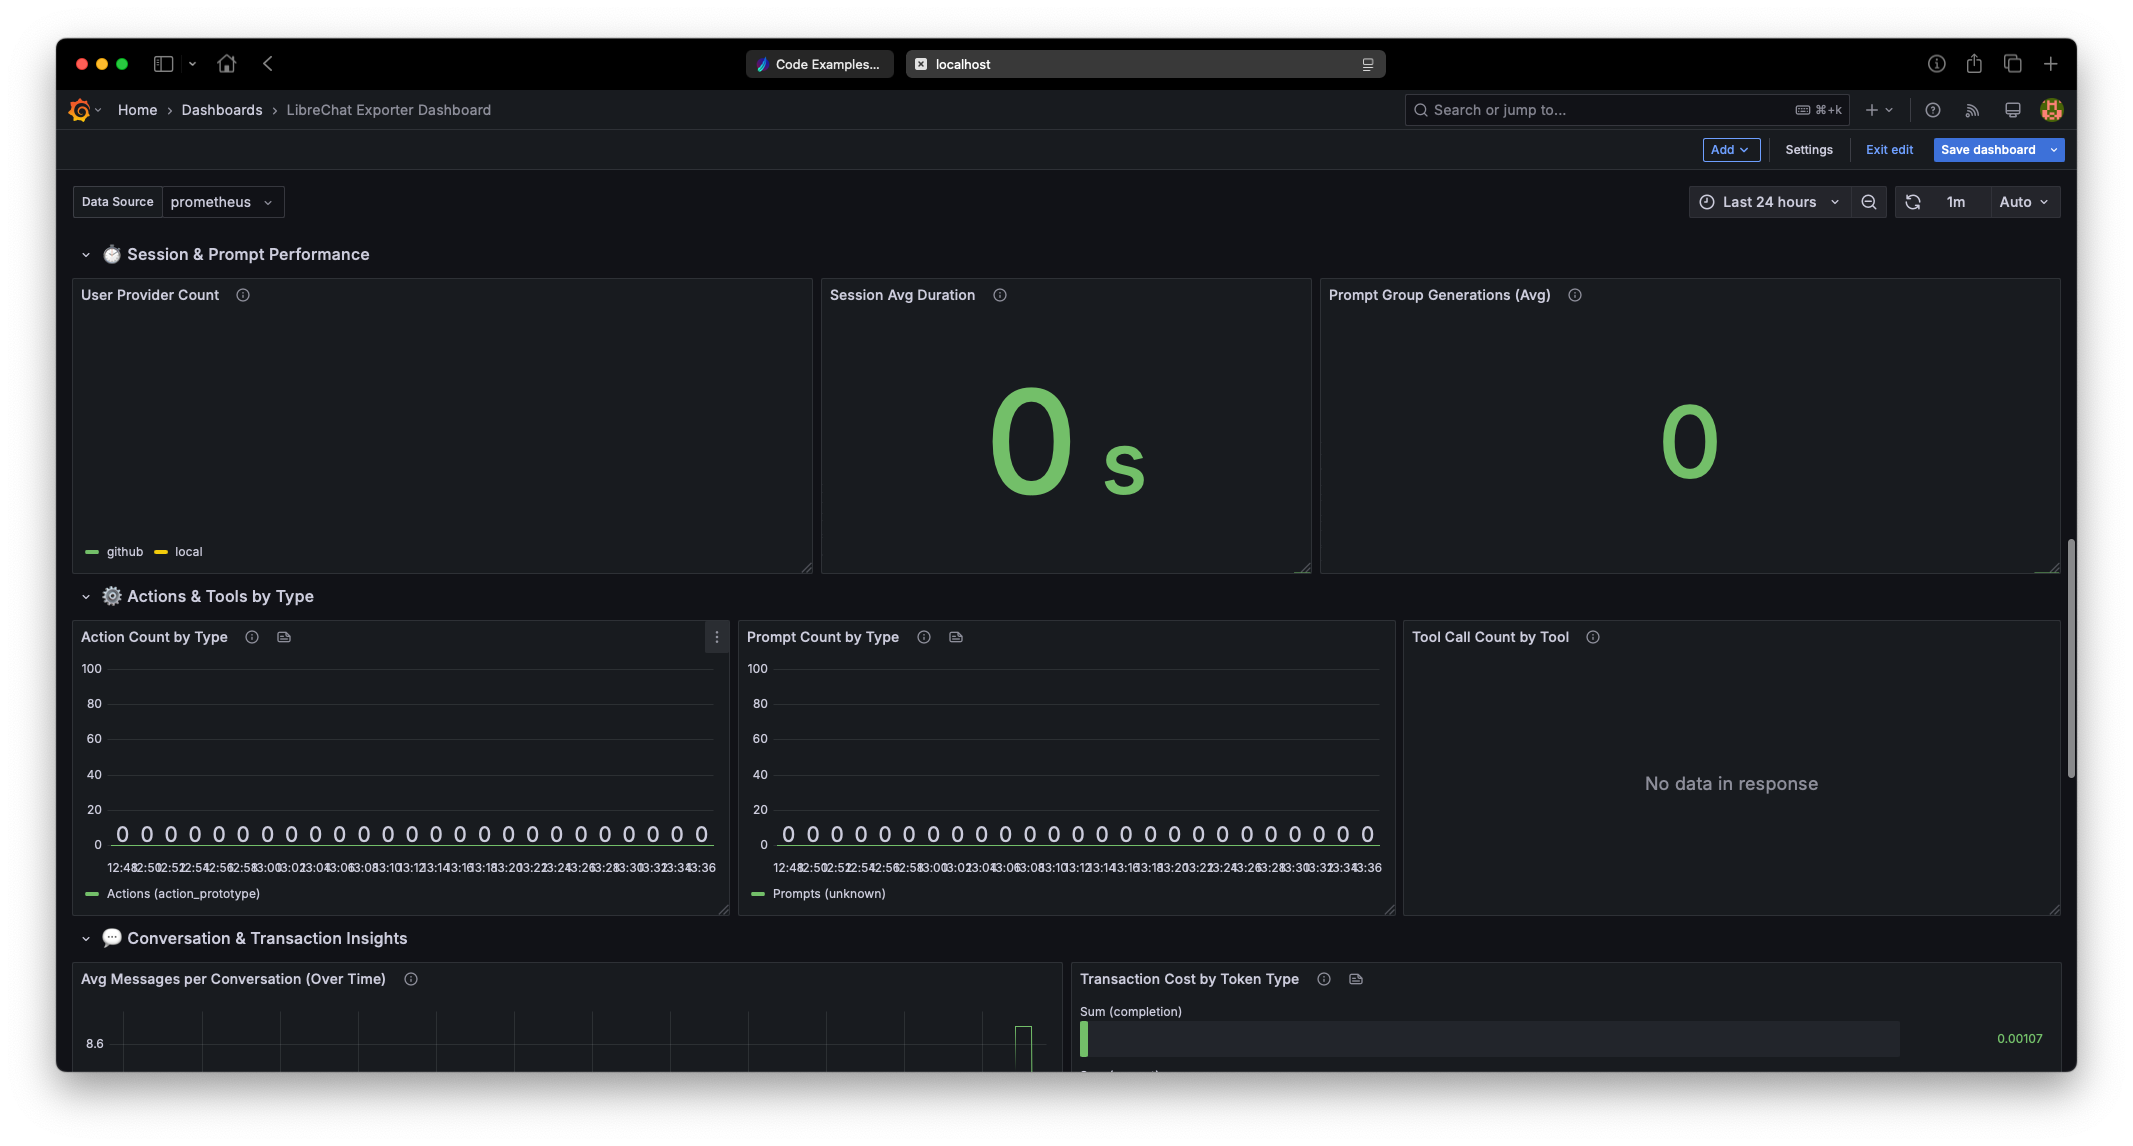
- Session & Prompt Performance — average session duration, prompt-group generations.
- Actions & Tools by Type — bar charts for action and prompt counts, tool-call usage.
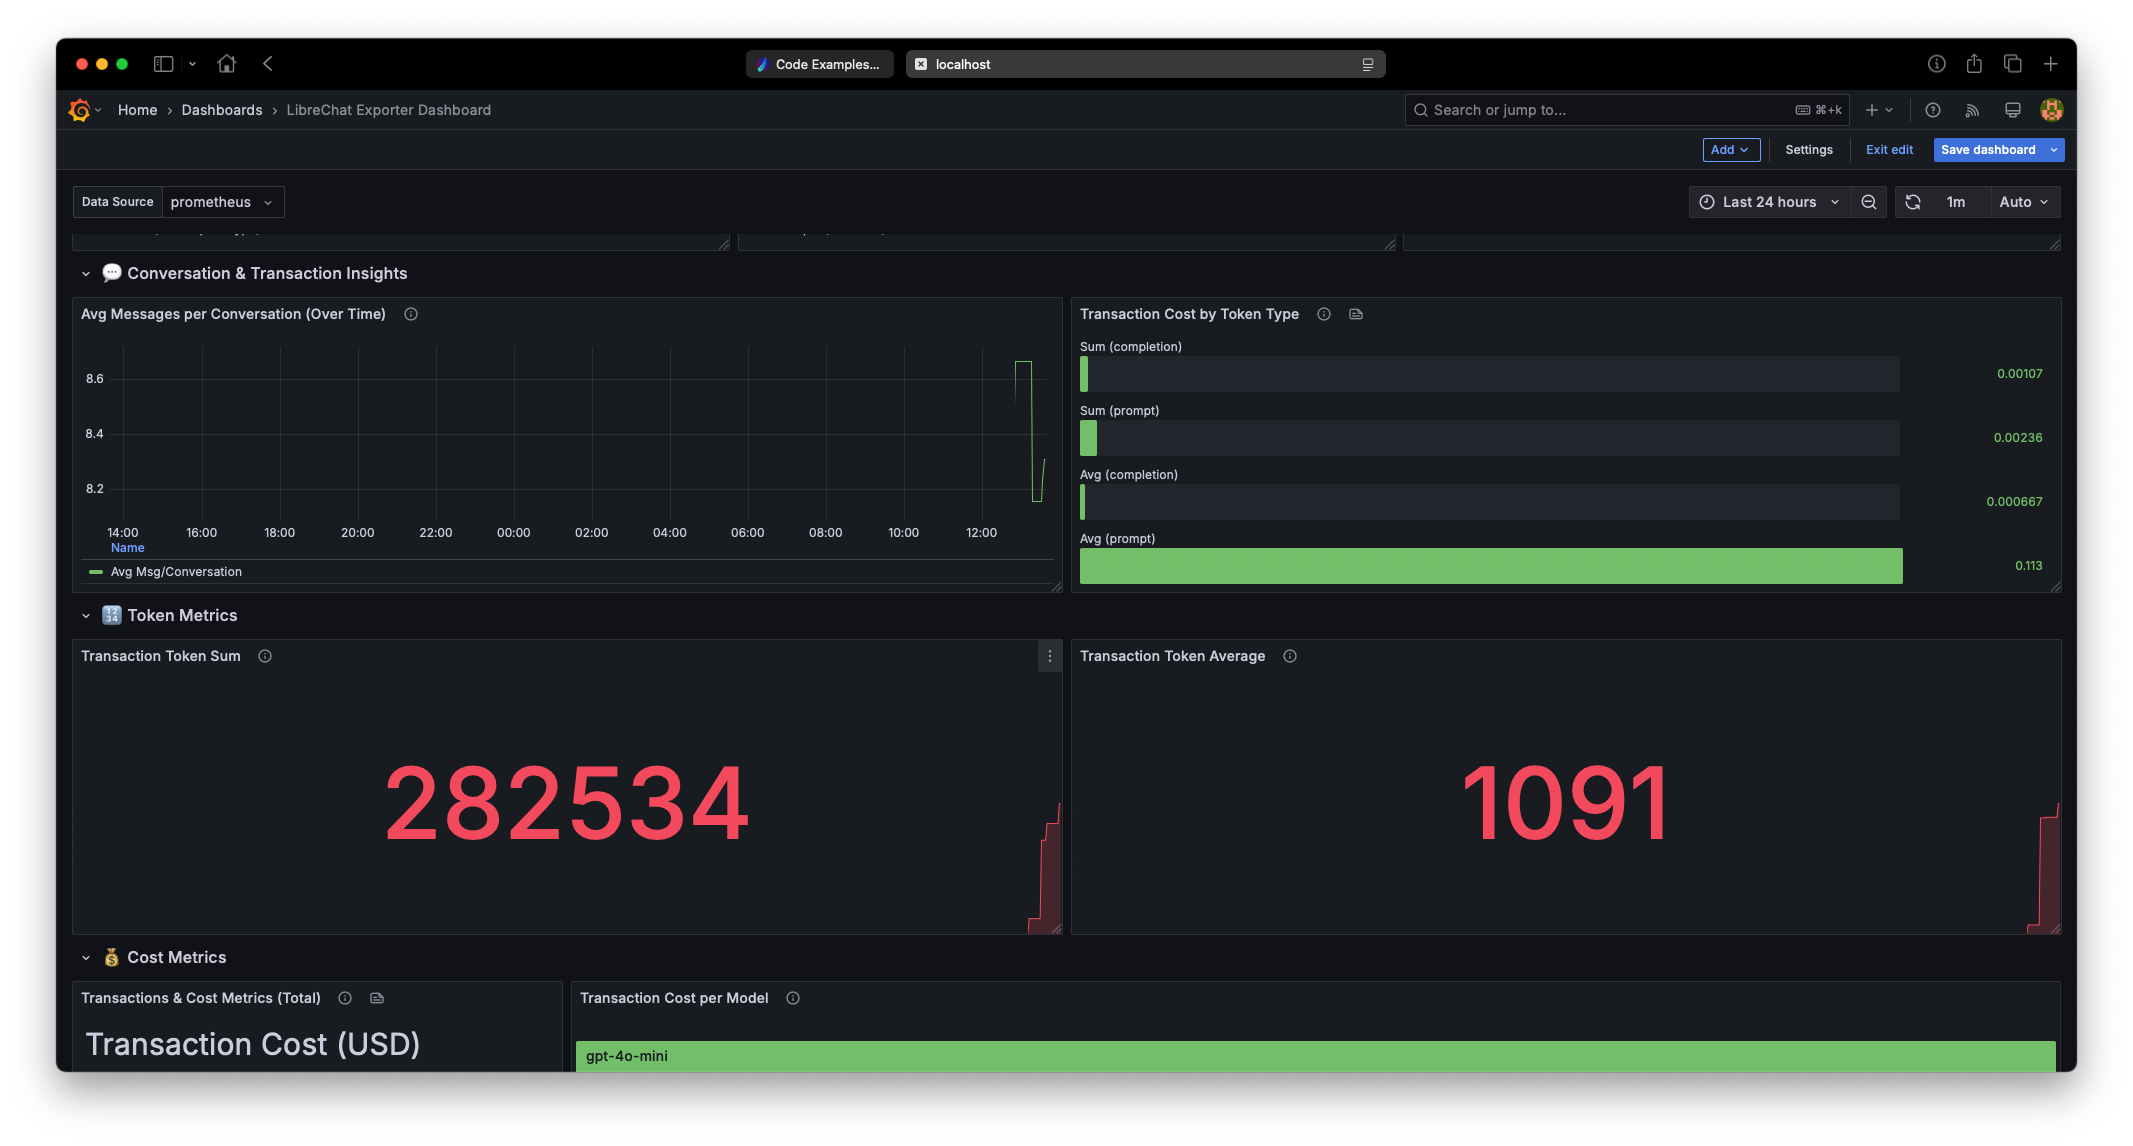
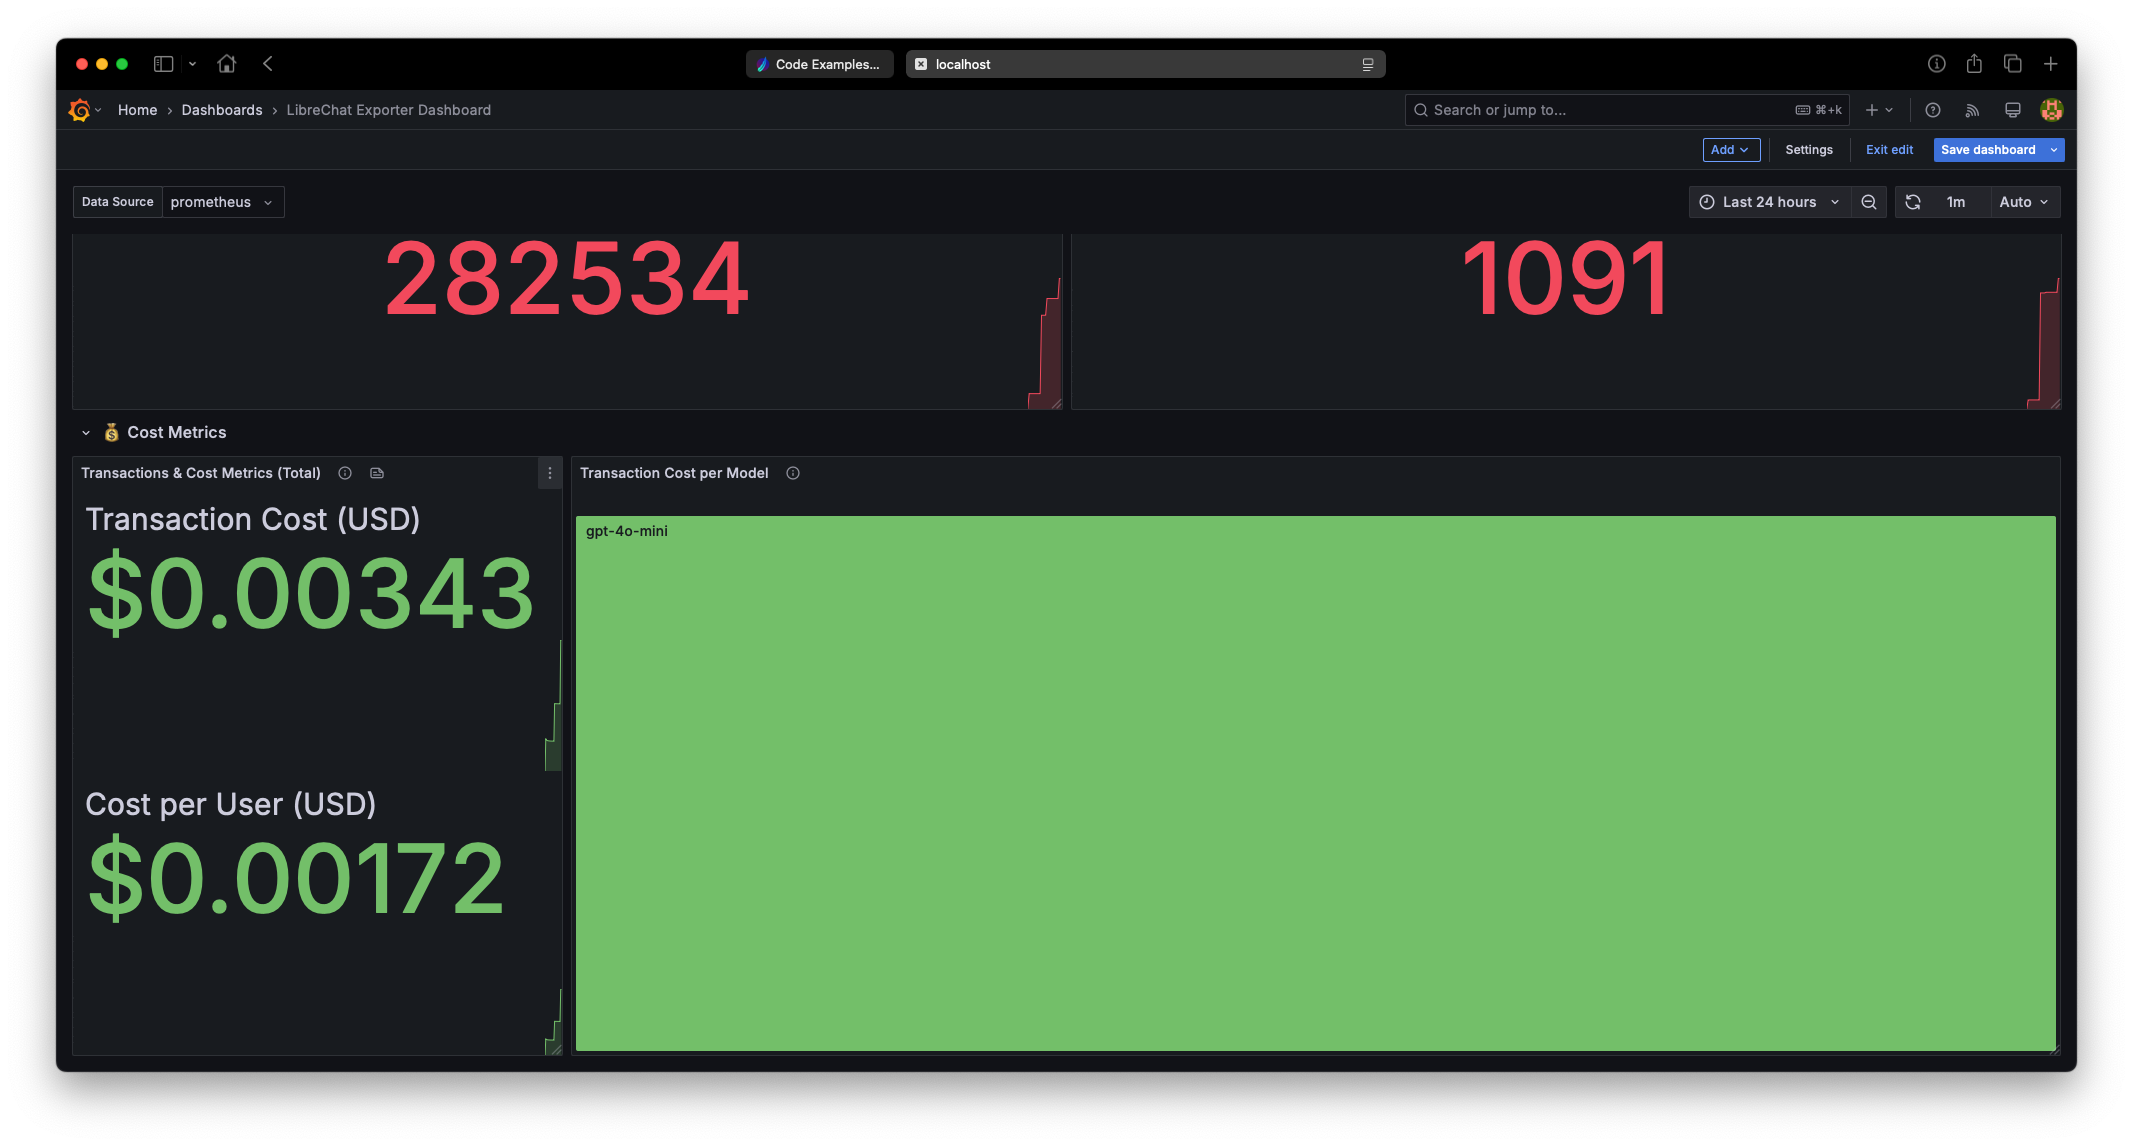
- Conversation & Transaction Insights — average messages per conversation, transaction-cost breakdown, token sums.
How to import
- In Grafana: Dashboards → New → Import.
- Upload
librechat-exporter-dashboard.jsonor paste its contents. - Pick your Prometheus data source (the one configured to scrape the exporter — see Prometheus & Grafana setup).
- Save.
Screenshots
Want to contribute a dashboard?
Share your dashboard JSON via a PR — see Ways to contribute.